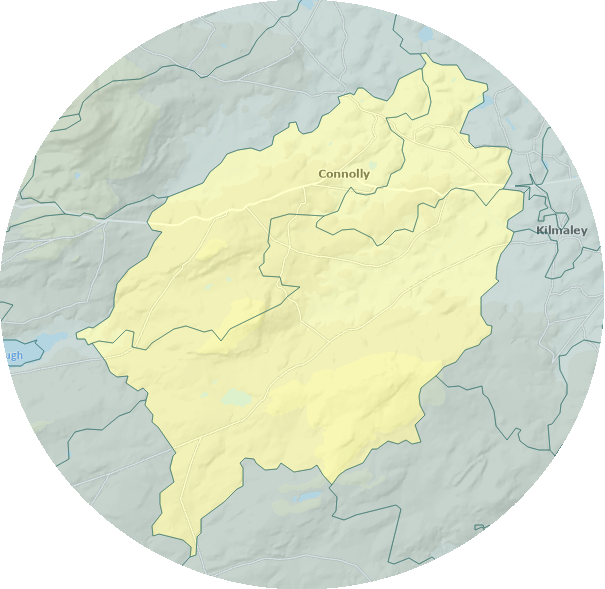
Connolly SEC Map

Connolly Sustainable Energy Community

CCEA are delighted to work with the Connolly SEC, part of Connolly Tidy Villages, to create the Energy Master Plan for the community


Community Energy Data

Based on Census 2022 and SEAI Building Energy Rating data (BER data updated 6 Oct 2026)

Population
781
Homes
360
Vacancy Rate
19.7%
9 holiday · 62 vacant
BER Coverage
46.0%
Median BER Rating
D
mean 334 kWh/m²/yr
Motor Cars
518
2025 est.
Baseline Energy Usage — MWh/year, apportioned from national SEI06 2024
Sector Electricity (MWh) Fossil Fuel (MWh) Renewable (MWh) Total (MWh)
Residential 1,198 2,992 201 4,391
Community See Audits 7 25 0 33
Transport 82 5,180 452 5,714
Population used: 781 of 5,458,600 national (0.014%) — calculated 29 Sep 2026
Baseline Emissions & Cost — per year, Apr–Sep 2026 prices
Electricity Fossil Fuel Renewable Transport Total
CO2 (tCO2e) 270.1 775.5 — 1,258.2 2,303.7
Total Cost €438,802 €436,297 €20,798 €1,135,827 €2,031,725
Transport Energy, Emissions & Cost — private cars, per year
Electricity Fossil Fuel Renewable Total
Energy (MWh) 82 5,180 452 5,714
CO2 (tCO2e) 18.4 1,239.8 — 1,258.2
Total Cost €22,367 €1,024,112 €89,349 €1,135,827

Energy per Sector (MWh/yr)

Cost per Sector (€/yr)

Emissions per Sector (tCO2e/yr)

Residential Community Transport
Age of Homes — Census 2022, permanent private households
Houses by Age Group
Pre 1971 1971–1996 After 1997 Not stated
The largest age cohort is 1971–1996 homes at 40% of the housing stock. 36% of homes predate 1971, likely to have cavity-free solid-wall construction and low levels of insulation — the highest retrofit potential in the SEC. 23% were built after 1997 when Ireland's Building Regulations (Part L) introduced mandatory energy efficiency requirements, with further tightening in 2006 and 2011. The 1971–1996 cohort (40%) represents mid-vintage stock, often partially retrofitted but generally below current insulation standards.
House Age and BER Coverage
Housing Tenure — Census 2022 vs Co. Clare
BER Ratings — % of homes with a BER vs Co. Clare and Ireland
Homes with a BER by rating group
A0–B C–D E–G
In the SEC, 26% of homes with a BER are rated B or better, against 30% in Co. Clare. The G band is most over-represented, at 28% versus 11% in the county, and the C band most under-represented, at 19% versus 32%. Some 55% of homes with a BER are rated D–G, against 38% in the county. Nationally, 37% of homes with a BER are rated B or better, above the SEC, and 32% D–G, below it. With 174 of the SEC's 378 homes (46%) holding a BER and data for all three Small Areas, confidence is moderate, though BERs over-represent homes recently sold, let, built or grant-upgraded. BER ratings are the yardstick for progress under the Climate Action Plan, and one national goal is to bring 500,000 homes (about 25%) to B or better by 2030. In the SEC, 26% of homes with a BER are in the A0–B group, 31% in C–D and 44% in E–G. C–D homes are closest to the target and would generally need fewer measures to reach a B. E–G homes offer the greatest energy, cost and emissions savings per home, and the SEC's E–G share exceeds the county's 25% and Ireland's 21%. Stone walls feature in 33% of homes with a BER, against 10% in the county, and usually need internal or external insulation. Oil heats 76% of homes with a BER, against 54% in the county, so heating-system replacement is likely central to any upgrade project.
Cars per Household — Census 2022, scaled × 1.109 to 2025
% of households, Census 2022. Pie chart counts are scaled to 2025; percentages are unchanged by scaling.
Small Areas (SAs)
Type Code Name %
SA A037063001 100%
SA A037082002 100%
SA A037105001 In Kinturk ED 100%
CSO Tables Consulted
Table Level Description
SAP2022T15T1SA SA Number of homes with 0,1,2,3,4 or more cars
SAP2022T1T1ASA SA Population , breakdown by sex
SAP2022T2T1SA SA Population data, breakdown by country of origin
SAP2022T6T2SA SA Housing number by age, divided into different age-bands
SAP2022T6T3SA SA Type of occupancy, e,g, ower, renter etc.
SAP2022T6T5SA SA Central heating Type
SAP2022T6T8SA SA Occupancy on Census night, i.e. number of houses vacant, holiday homes, occupied by usual residents, occupied by visitors, temporarily absent