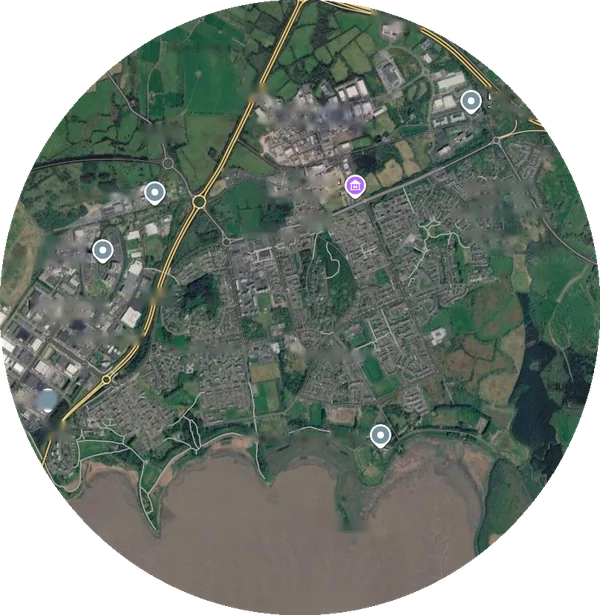
Shannon SEC Map

Shannon Sustainable Energy Community

CCEA are delighted to work with the Shannon SEC to create the Energy Master Plan for the community.


Community Energy Data

Based on Census 2022 and SEAI Building Energy Rating data (BER data updated 6 Oct 2026)

Population
5,568
Homes
2,095
Vacancy Rate
3.8%
3 holiday · 77 vacant
BER Coverage
66.8%
Median BER Rating
C
mean 184 kWh/m²/yr
Motor Cars
2,717
2025 est.
Baseline Energy Usage — MWh/year, apportioned from national SEI06 2024
Sector Electricity (MWh) Fossil Fuel (MWh) Renewable (MWh) Total (MWh)
Residential 8,541 21,330 1,435 31,307
Community See Audits 135 102 0 236
Transport 430 27,171 2,370 29,971
Total 9,106 48,602 3,806 61,514
Population used: 5,568 of 5,458,600 national (0.102%) — calculated 15 Oct 2026
Baseline Emissions & Cost — per year, Apr–Sep 2026 prices
Electricity Fossil Fuel Renewable Transport Total
CO2 (tCO2e) 1,943.9 5,508.0 — 6,599.4 14,051.3
Total Cost €3,158,046 €3,099,017 €148,280 €5,957,606 €12,362,949
Transport Energy, Emissions & Cost — private cars, per year
Electricity Fossil Fuel Renewable Total
Energy (MWh) 430 27,171 2,370 29,971
CO2 (tCO2e) 96.3 6,503.1 — 6,599.4
Total Cost €117,319 €5,371,639 €468,648 €5,957,606

Energy per Sector (MWh/yr)

Cost per Sector (€/yr)

Emissions per Sector (tCO2e/yr)

Residential Community Transport
Age of Homes — Census 2022, permanent private households
Houses by Age Group
Pre 1971 1971–1996 After 1997 Not stated
The largest age cohort is 1971–1996 homes at 45% of the housing stock. 13% of homes predate 1971, likely to have cavity-free solid-wall construction and low levels of insulation — the highest retrofit potential in the SEC. 40% were built after 1997 when Ireland's Building Regulations (Part L) introduced mandatory energy efficiency requirements, with further tightening in 2006 and 2011. The 1971–1996 cohort (45%) represents mid-vintage stock, often partially retrofitted but generally below current insulation standards.
House Age and BER Coverage
Housing Tenure — Census 2022 vs Co. Clare
BER Ratings — % of homes with a BER vs Co. Clare and Ireland
Homes with a BER by rating group
A0–B C–D E–G
In the SEC, 33% of homes with a BER are rated B or better, against 30% in Co. Clare. Band C is the most over-represented (36% versus 32%) and band G the most under-represented (2% versus 11%). Some 30% of homes with a BER are in the D–G bands, compared with 38% in the county. Nationally, 37% are rated B or better, so the SEC is below Ireland. With 1,488 of the SEC's 2,229 homes (67%) holding a BER and data for all 17 Small Areas, confidence is high, though homes that were sold, let, newly built or upgraded with a grant tend to be over-represented. BER ratings are the yardstick by which progress under the Climate Action Plan is measured, and one national goal is to bring 500,000 homes (about 25%) to B or better by 2030. In the SEC, 33% of homes with a BER are in the A0–B group, 54% in C–D and 13% in E–G. C–D homes are closest to the target and would generally need fewer measures to reach a B. E–G homes offer the greatest energy, cost and emissions savings per home and make up 13% of homes with a BER, against 25% in the county and 21% nationally. Poor heating controls affect 62% of homes with a BER, against 53% in the county, so controls upgrades could be a measure shared across many homes. Gas heats 36% of homes with a BER, against 13% in the county, which shapes planning for a move to low-carbon heating such as heat pumps.
Cars per Household — Census 2022, scaled × 1.109 to 2025
% of households, Census 2022. Pie chart counts are scaled to 2025; percentages are unchanged by scaling.
Small Areas (SAs)
Type Code Name %
SA A037027003 100%
SA A037027004 100%
SA A037027005 100%
SA A037027007 100%
SA A037027008 100%
SA A037027009 100%
SA A037027010 100%
SA A037027011 100%
SA A037027012 100%
SA A037027013 100%
SA A037027014 100%
SA A037027015 100%
SA A037027017 100%
SA A037027019 100%
SA A037027020 100%
SA A037027021 100%
SA A037027022 100%
CSO Tables Consulted
Table Level Description
SAP2022T15T1SA SA Number of homes with 0,1,2,3,4 or more cars
SAP2022T1T1ASA SA Population , breakdown by sex
SAP2022T2T1SA SA Population data, breakdown by country of origin
SAP2022T6T2SA SA Housing number by age, divided into different age-bands
SAP2022T6T3SA SA Type of occupancy, e,g, ower, renter etc.
SAP2022T6T5SA SA Central heating Type
SAP2022T6T8SA SA Occupancy on Census night, i.e. number of houses vacant, holiday homes, occupied by usual residents, occupied by visitors, temporarily absent